Building Dashboards That Drive Results: What Distributors Should Track Daily, Weekly, Monthly
Summary:
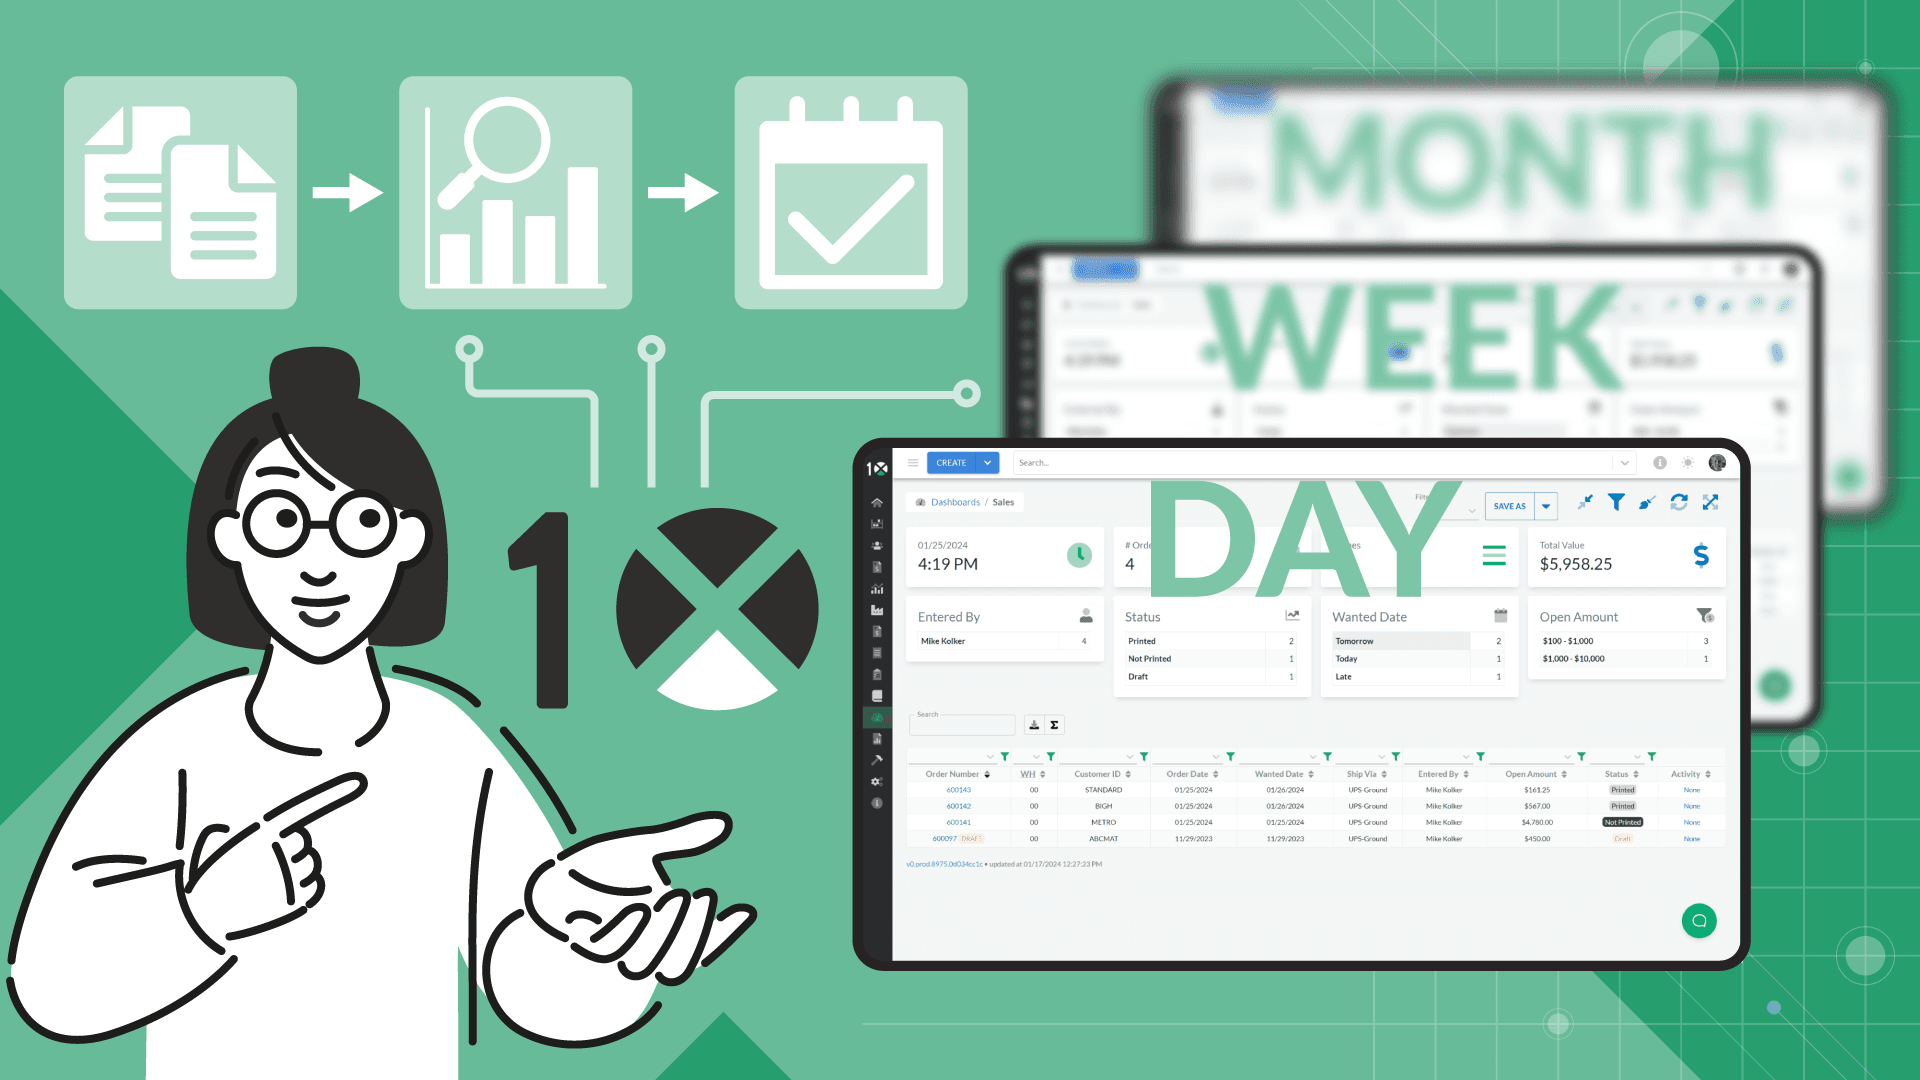
- Daily dashboards track real-time operational metrics—like orders, shipments, and payments—so teams can act quickly and keep workflows on track.
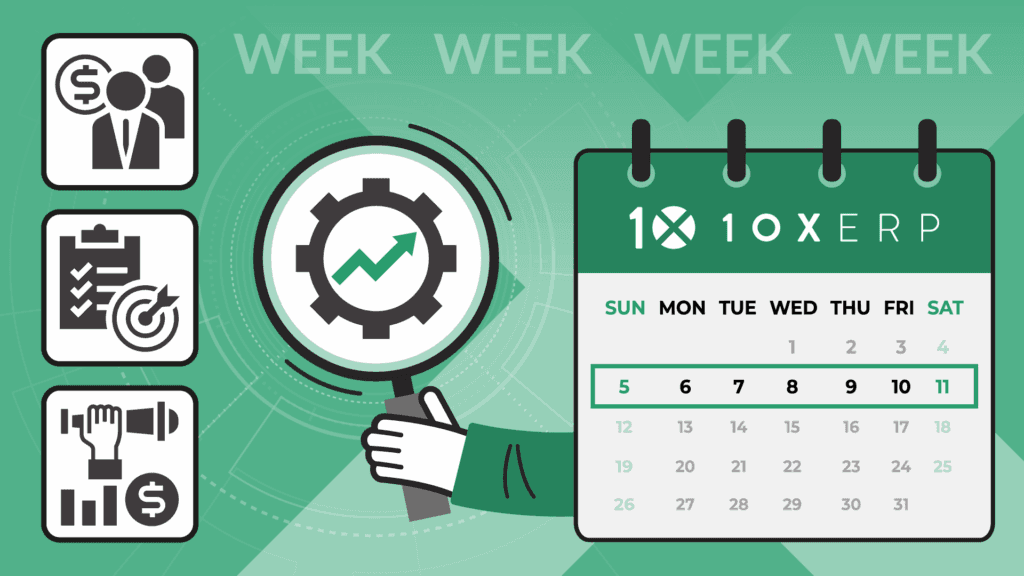
- Weekly dashboards reveal performance trends across sales, operations, and finance, enabling managers to spot patterns, adjust resources, and drive accountability.
- Monthly dashboards focus on strategic KPIs such as margins, inventory turns, and customer retention, guiding leadership in long-term planning and business growth.
In a fast-paced distribution environment, the ability to make informed decisions quickly and confidently can give your business a serious competitive edge. But decision-making is only as good as the data behind it. That’s why dashboards have become essential tools in the modern ERP experience.
The challenge isn’t just having access to data—it’s knowing what to track, when to review it, and how to visualize it in a way that’s actionable. At 10X ERP, we help distributors build dynamic, role-based dashboards that transform raw data into insights and insights into results.
Here’s how to approach dashboard strategy by breaking it down into three key cadences: daily, weekly, and monthly. Each level serves a distinct purpose, helping to keep your team focused, responsive, and aligned.
The Role of Dashboards in Distribution
Dashboards in ERP systems are not just for executives; they are also valuable tools for non-executive personnel. In a well-designed ERP like 10X, dashboards can be tailored to every role, from sales and purchasing to warehouse operations and finance. The goal is to surface the correct data at the right time, without having to dig through spreadsheets or wait for reports.
When designed thoughtfully, dashboards act as early-warning systems, performance trackers, and planning tools. They highlight what’s working, what’s slipping, and what needs immediate attention, keeping everyone accountable and focused on the metrics that move the business forward.
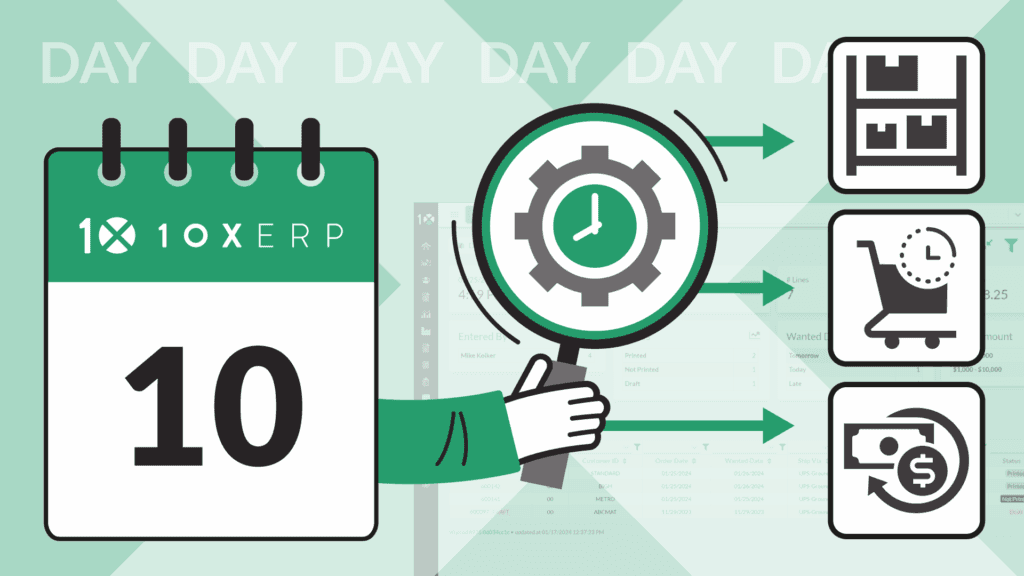
What to Track Daily
Daily dashboards are all about operational awareness. These are the real-time metrics that alert your team to what’s happening right now, so they can take immediate action when something veers off track.
For warehouse teams, this might include pending orders, unfulfilled shipments, inventory shortages, or inbound receiving. For sales teams, daily dashboards should highlight new orders, order values, and customer requests. Accounting might watch cash inflows, invoice statuses, or overdue payments.
These dashboards aren’t about strategy—they’re about execution. The purpose is to keep work flowing smoothly and ensure that minor problems are resolved before they become larger disruptions.
What to Track Weekly
Weekly dashboards zoom out slightly to provide operational trends and departmental accountability. While daily data gives you a snapshot, weekly views help you identify patterns and begin to ask why something happened.
Sales managers might review weekly sales by rep, conversion rates, or top customers. Operations leaders often look at order accuracy rates, backorders, picking efficiency, and vendor lead time performance. Finance teams may review short-term cash forecasts or weekly profit margins.
This cadence enables managers to assess performance against short-term targets, make mid-course corrections, and more effectively allocate resources for the upcoming week. It’s also a great way to drive conversations in team meetings—using the data to identify what needs to change, not just what
happened.
What to Track Monthly
Monthly dashboards serve as your strategic lens. These are the high-level KPIs that track growth, profitability, and business health over time. They help leaders evaluate whether key initiatives are working and guide decisions around pricing, staffing, procurement, and long-term planning.
Every month, distributors may track gross margin by product category, top-performing SKUs, inventory turns, customer churn, and on-time delivery rates. For finance and leadership teams, dashboards may include financial performance against budget, working capital ratios, or forecast accuracy.
Unlike daily or weekly dashboards, these reports are often comparative, measuring results against past months, quarters, or year-over-year benchmarks. The focus shifts from reacting to current activity to learning from past performance and shaping future direction.
Making Dashboards Work in 10X ERP
Dashboards should be more than static charts—they should be interactive, role-specific, and easy to digest. In 10X ERP, users can customize their dashboards to view only the metrics that matter to them, with data updated in real-time from across the system.
Sales reps can track open quotes, order status, and customer activity without ever leaving their screen. Warehouse managers can view stock levels, late picks, and upcoming replenishments. Executives can review consolidated metrics that pull together operations, sales, and finance—all in one place.
And because the dashboards are built on clean, real-time ERP data, there’s no need to reconcile conflicting numbers from different systems. Everyone operates from the same source of truth.
Conclusion
Dashboards don’t just display numbers—they drive focus. By tracking the right metrics at the right intervals, distributors can move from reactive firefighting to proactive, data-informed decision-making.
At 10X ERP, we help companies design dashboards that support the way they work, so they can spend less time analyzing and more time acting. Want to build dashboards that fuel real results? Contact us to see how we can help.
Ready to Transform Your Distribution Business?
Let us help you implement solutions that drive real results.
Contact Us TodayGet insights delivered to your inbox
Product updates, distribution industry insights, and company news.
Related Articles
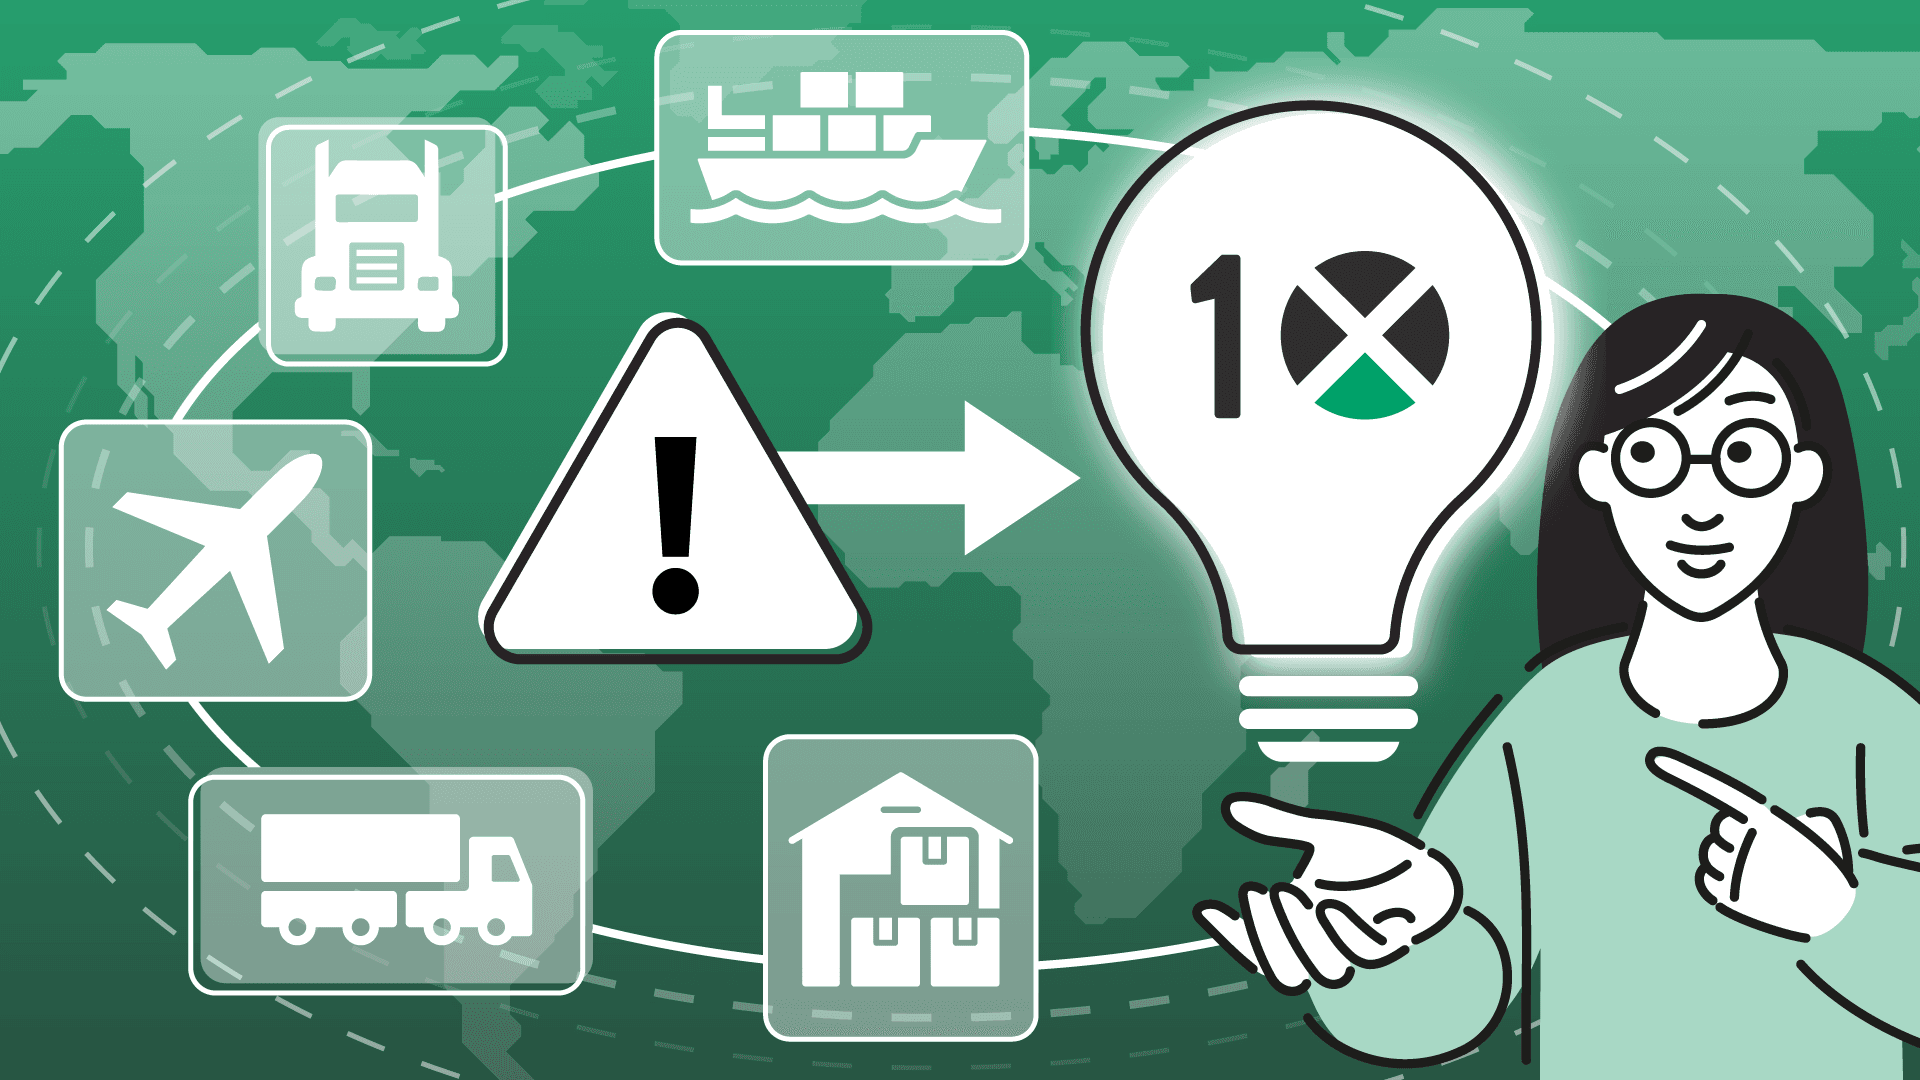
Preparing for Supply Chain Disruption: How ERP Is Your Most Critical Risk Hedge
Discover how modern ERP systems like 10X ERP help distributors navigate supply chain disruptions with real-time visibility, automation, and data-driven insights to improve resilience and profitability.
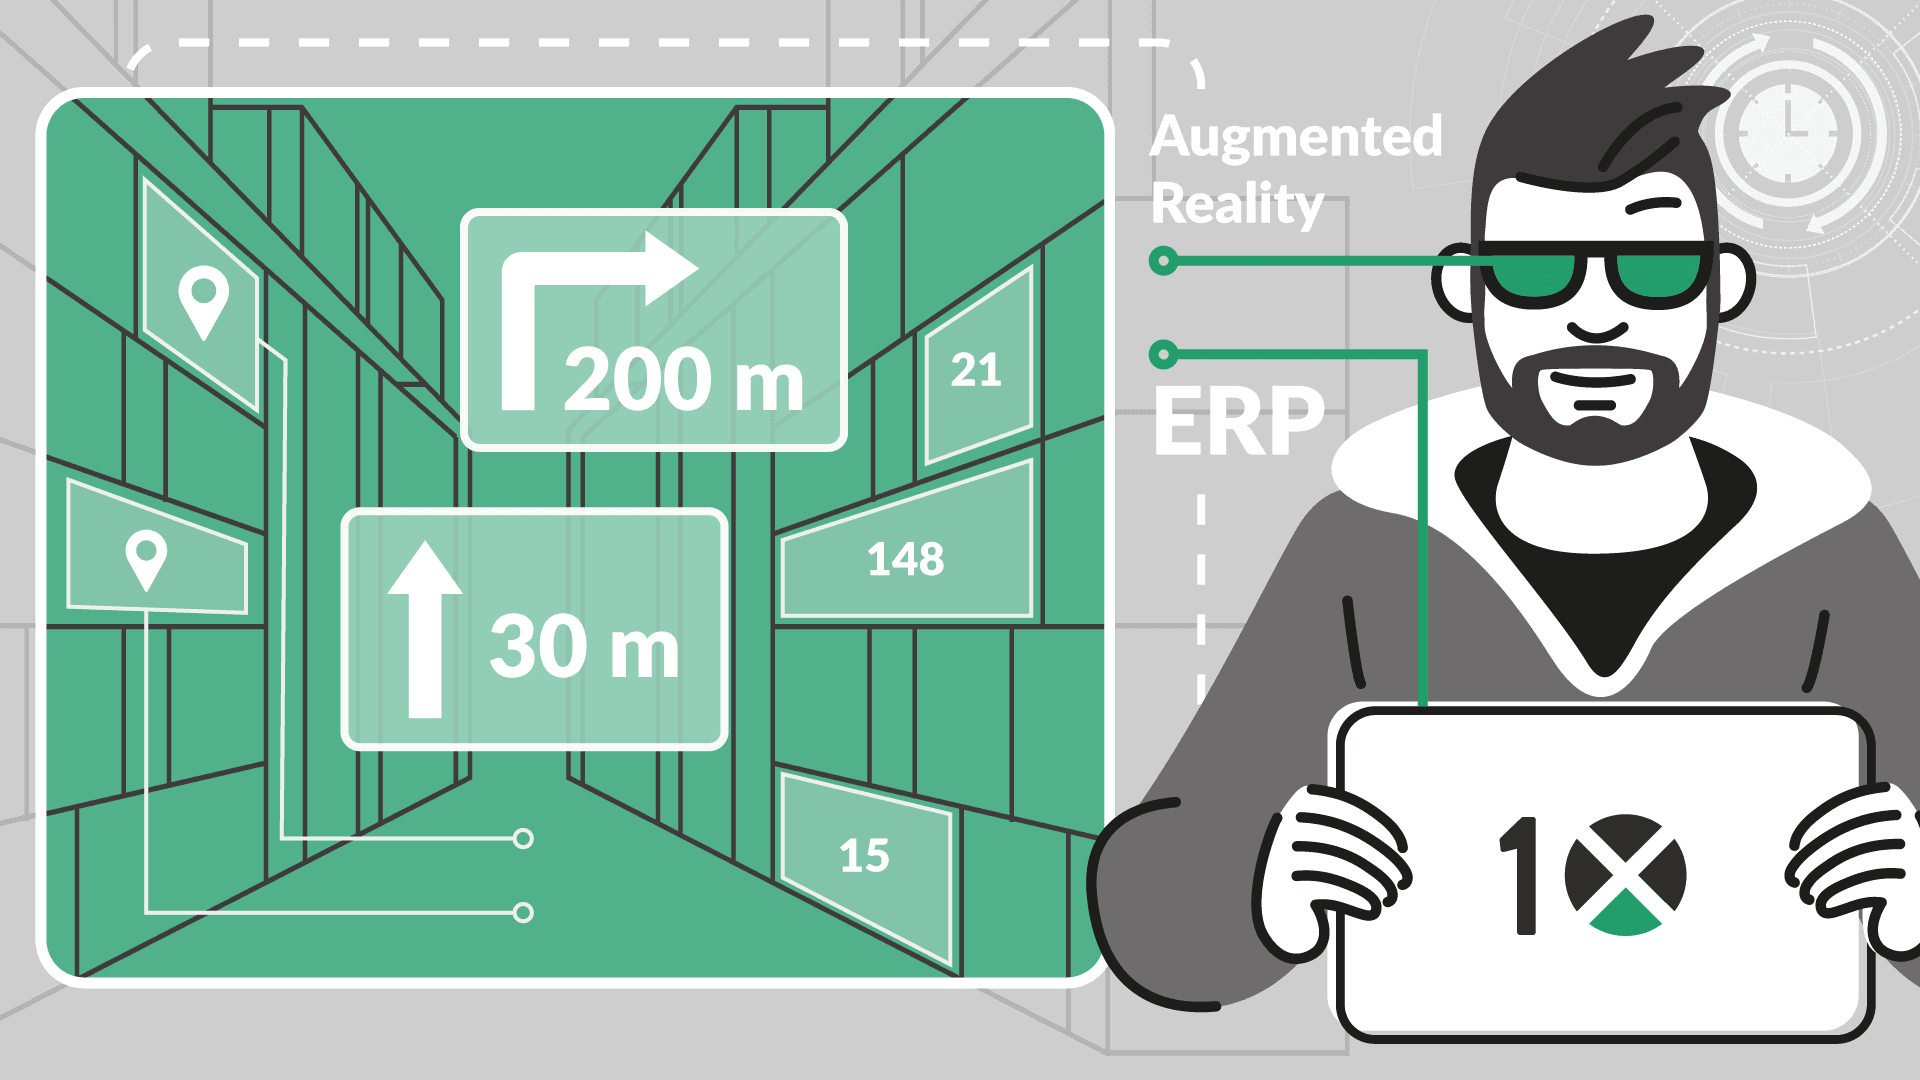
Augmented Reality in Warehouse Operations: The Future of Efficient Distribution
Augmented Reality (AR) is transforming warehouse operations by overlaying real-time ERP data, such as picking instructions, inventory levels, and navigation cues, directly into workers’ field of view. When integrated with 10X ERP, AR improves accuracy, speeds fulfillment, and streamlines training while reducing errors and operational costs. Discover how AR-powered warehouses are becoming smarter, faster, and more efficient in today’s competitive distribution landscape.